
VR Shopper Insights Are Transforming Category Management and CPG Decision-Making
Thanks to virtual reality (VR) shopper research, category leaders have access to a level of behavioral insight that was impossible just a few years ago.
By placing real shoppers inside immersive 3D store environments, CPG teams can measure behaviors with scientific precision: Where consumers look, what they notice first, what they ignore, how long they linger, and what ultimately drives conversion.
These valuable shopper insights translate directly into smarter assortments, stronger packaging, optimized planograms, and more accurate retail forecasting.
Below are the eight VR-based shopper KPIs every Category Manager and Consumer Insights Analyst should be tracking.
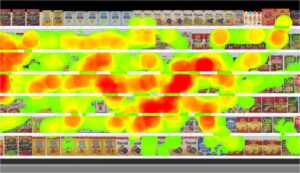
Fixations & Gaze Points: What Shoppers Notice First
Eye-tracking inside VR store simulations reveals which SKUs, brand blocks, and packaging elements attract attention at both the shelf and category level. This KPI helps category management teams understand:
- Which items shoppers notice instantly
- How packaging redesigns shift visibility
- Whether hero products are actually functioning as anchors
- How shopper attention changes by channel, store format, or competitor set
Heatmaps and gaze plots deliver unbiased visibility into what actually draws attention — not what shoppers think will draw their attention.
Fixation Duration: How Long Shoppers Stay Engaged
Attention is only half the story. Fixation duration shows how long shoppers remain engaged, which correlates to:
- Comprehension of pricing or claims
- Confusion caused by design, clutter, or complexity
- Shelf elements that cause hesitation or friction
Average fixation duration helps optimize messaging hierarchy, while first fixation duration reveals which elements create instant appeal. Together, this data guides packaging, facings, shelf signage, and category flow.
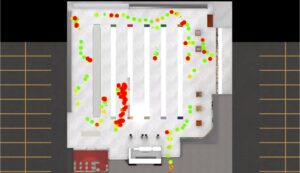
Shopper Traffic & Pathing: How Consumers Navigate to Your Category
VR path tracking shows precisely how shoppers move through a store to find your category: Where they slow down, where they turn, and where they stop entirely. These data points help category management teams:
- Measure how easily shoppers find the category
- Identify friction points in the path to the aisle
- Locate traffic-driving categories
- Predict exposure to new products
- Optimize adjacencies
- Diagnose low-performing shelf locations due to poor visibility
Traffic heatmaps immediately show high- and low-engagement zones, enabling evidence-backed redesigns. (See how a leading food CPG saved $370K in redesign costs using VR research.)
Stopping Power: What Interrupts the Shopper Journey
“Stopping power” measures how effectively a product or display interrupts the shopper’s path and earns attention long enough to drive consideration. VR shopper testing reveals:
- Which planograms naturally pull shoppers in
- What shelf elements create friction vs. engagement
- Which SKUs trigger pause, comparison, and re-evaluation
Category leaders can quickly compare competing layouts to determine which version disrupts autopilot shopping behavior most effectively.
Total Users Noticed: The True Measure of CPG Visibility
“Total users noticed” uncovers hidden visibility gaps before they show up in the store. This KPI tracks how many shoppers actually saw an item, not just those who engaged with it. It’s essential for:
- Launching new SKUs
- Measuring equity between brand blocks
- Evaluating claim and color hierarchy
- Testing packaging redesign impact
- Validating that hero items perform as intended
Understanding total visibility before a reset ensures hero products don’t get lost on the shelf. With VR, category teams can validate visibility early and confidently bring high-performing planograms to market.
Number of Revisits: Reconsideration & Confusion Signals
VR eye-tracking captures how many times shoppers return their gaze to the same product or area. Multiple revisits suggest:
- High interest and comparison
- Confusion or uncertainty
- Ineffective pricing or claim clarity
- Difficulty navigating the category
Revisits help category teams determine whether the product placement is compelling or causing friction.
Conversion Rate: The KPI That Predicts Sales Lift
Ultimately, Category Managers need to understand what percentage of shoppers convert once they reach the shelf. VR shopper research enables analysts to test:
- New packaging
- New shelf layouts
- Alternative assortments
- Promotional triggers
- Pricing variations
Because VR captures both behavior and outcomes, it provides a clear link between what shoppers do and what they buy, enabling more cost-effective in-store pilots.
Sales per Square Foot: Space Productivity at the Category Level
VR store simulations allow teams to quantify how effectively each segment, subcategory, or planogram uses available space. Category managers can evaluate:
- Shelf length and product density
- Facings and vertical/horizontal blocking
- Visual area and navigation effort
- Impact of SKU rationalization
Sales per square foot is one of the most direct indicators of how well a category strategy is performing, and virtual reality testing helps teams forecast improvements before making physical changes.
Why VR-Based KPIs Matter More Than Ever
Category leaders are now expected to deliver:
- Better assortments
- Faster decisions
- Stronger forecast accuracy
- Higher space productivity
- Consumer-first experiences
Achieving this requires behavioral insights, not just sales data. Virtual reality consumer insights connect the dots between shopper behavior, category strategy, and performance. This process gives category teams a faster, cheaper, and more predictive alternative to physical tests.
The Real Cost of Ignoring Shopper Behavior
Shopper insights aren’t optional because poor execution is expensive. According to One Door’s latest research, poor visual merchandising costs retailers $125 billion in lost sales every year. Much of that loss comes from:
- Poor product visibility
- Confusing shelving
- Weak aisle navigation
- Ineffective in-store messaging
VR shopper research gives category teams the data they need to prevent these losses before they occur. Download The Cost of Poor Visual Merchandising Report and start making shopper-driven decisions that grow your categories.