
The 6 Different Types of Planograms — And Why Retail Needs a Digital Future
For decades, paper planograms (POGs) have been the backbone of retail merchandising. They’ve helped category managers, visual merchandisers, and store teams organize products, optimize shelf space, and maintain brand consistency across locations.
But while paper planograms once provided structure, they were built for a slower, less complex retail environment. Today’s shoppers expect more, like localized assortments, faster resets, and seamless in-store experiences.
Static PDF planograms simply can’t keep up. To see how planogram formats have evolved to meet today’s demands, it helps to understand the six most common types and the role each plays in visual merchandising.
The 6 Most Common Types of Planograms
Floor Plan Planogram
A Floor Plan POG provides a bird’s-eye view of a store’s overall layout: Aisles, shelving, displays, and departments. The goal is to optimize space and guide customers through the shopping journey.
When done well, these planograms improve store navigation and enhance the customer shopping experience. Examples of Floor Plan POGs include:
- Space Optimization Planogram, which maximizes shelf and floor space by placing products strategically, often using data and analytics.
- Store Reset, which reorganizes store layouts and displays to align with seasonal changes, new launches, or promotions.
Display Planogram
Display POGs dictate how products should be arranged in high-visibility areas like endcaps, windows, and promotional zones. Their goal is impact: Creating visually engaging displays that spark impulse purchases and align with retail marketing campaigns.
These planograms consider not just product placement but also experiment with how creative signage, lighting, and props can engage shoppers. Common variations of Display Planograms include:
- Seasonal Planogram, which creates themed displays for holidays or events.
- Promotional Planogram, which highlights products tied to sales or marketing campaigns.
- Micro Space Planogram, which optimizes small, high-traffic display areas like endcaps.
- Visual Merchandising Planogram, which uses color, lighting, and signage to enhance product appeal.
- Experiential Planogram, which designs interactive displays to engage customers directly.
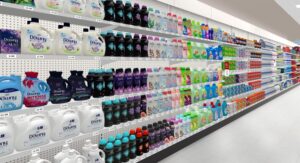
Shelf (Image) Planogram
The most recognizable type, Shelf or Image POGs, focus on everyday product placement on standard shelving units, pegs, or gondolas. They ensure brand consistency across stores, help shoppers find products more easily, and highlight top-selling products in prime positions.
Examples of Shelf (Image) Planograms include:
- Category Planogram, which groups similar items within a department for easy navigation.
- Assortment Planogram, which selects SKUs to reflect customer preferences and local demand.
- Space Allocation Planogram, which assigns shelf space based on sales performance or seasonality.
- Top Sellers Planogram, which prioritizes the placement of best-selling products.
Schematic Planogram
Schematic POGs are simplified layouts that make store execution easier for associates. Instead of detailing every facing, they highlight key categories and product groupings, so store teams can implement resets more quickly. Schematic POGs also make manual compliance checks — an arduous task across hundreds of stores — easier.
Retailers often use Schematic Planograms for:
- New Campaigns, which provide store teams with updated layouts during major resets.
- Store Compliance, which ensures displays follow brand standards consistently across locations.
Analysis Planogram
Analysis POGs aren’t about execution — they’re about evaluation. These planograms incorporate metrics, heatmaps, and visual data to demonstrate how shoppers move through a store, where they stop, and which products capture attention.
By analyzing these shopper insights, retailers can refine their visual merchandising strategies, improve store layouts, and increase sales performance.
Examples of Analysis Planograms include:
- Aisle Heatmap, which uses color-coded visuals to show where shoppers focus their attention.
- Path-Tracking Heatmap, which maps how shoppers move through the store to identify high- and low-traffic zones.
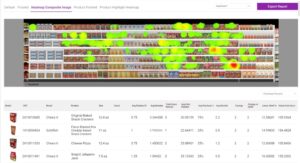
Standard Planogram Report
Standard POG Reports consolidate the data behind planogram execution and store performance. They track everything, from sales results and compliance to space utilization.
These reports give retail teams a consistent way to measure the effectiveness of visual merchandising and help managers adjust strategies and ensure planograms are delivering on their goals. Retailers often use these types of Standard Planogram Reports:
- Product Data Report, which lists details like UPCs, facings, and product images to support analysis.
- Shopper Insight Data, which captures metrics, such as attention duration and purchase percentage, to improve merchandising decisions.
Why Paper Planograms Fall Short
Each of these planogram types plays an important role, but they all share one flaw: They’re static, one-size-fits-all, and usually delivered on paper or PDFs — a format built for the 1970s, not today’s fast-moving retail environment.
Now, stores are changing faster than ever. Shopper expectations shift weekly, and a static set of instructions is no longer helpful to digitally-native store teams. Associates need dynamic, real-time tools to execute plans with accuracy and agility.
The Evolution: Dynamic Digital Planograms
That’s why we believe: The paper planogram is dead. The digital planogram is alive — and it’s evolving into something far more powerful.
It’s important to remember that the format is what’s broken, not the concept. Dynamic digital planograms, like One Door’s Digital Store Model, transform planograms from static documents into living, adaptive workflows. They allow retailers to:
- Localize plans based on each store’s unique product mix and layout.
- Simplify store execution with interactive, step-by-step instructions.
- Align HQ and stores with real-time, two-way communication.
- Ensure compliance by tracking completion and accuracy across locations without ever leaving HQ.
- Concept and test assortment ideas using immersive 3D experiences, enabling retailers to see and interact with products or layouts before execution.
Digital planograms don’t just replace paper. They unlock a new way of working, as the first step to connecting design, planning, execution, and analytics in one platform.
Ready for What’s Next?
Traditional planograms helped define modern visual merchandising, but it’s time to evolve. Retailers need dynamic, digital planograms that are flexible, localized, and fast-moving — just like their customers.
Download our Dynamic Digital Planogram Guide to learn how leading retailers are moving beyond paper and embracing the Digital Store Model.